Chi-Square Test of Association with SPSS
Table of Contents
- Purpose of Chi-square Test of Association
- Grouped Data (Contingency Table) Example
- Ungrouped, Raw Data Example
1. Purpose of Chi-square Test of Association
The test of association, also known as the test of independence, enables one to determine whether two categorical (nominal or qualitative) variables appear to be associated or related, i.e., determine whether the distribution of one variable appears to change systematically with distribution of the second variable or whether the distribution of variable A is contingent upon variable B. Some example research questions and variables for which this test would be suitable include:
- Does support (support vs. no support) for a presidential candidate differ by political party affiliation (Republican, Democrat, Independent, vs. Other)?
- Do students who attend a dropout prevention program in 9th grade (attend vs. not attend) show different rates of dropping out behavior over the next 3 years (drop out vs. graduate)?
2. Grouped Data (Contingency Table) Example
In educational research whole classes may be used for quasi-experiments. Often it is essential to demonstrate that these classes show similar distributions by student demographics. Below in Table 1 are student racial distributions for two undergraduate college classes. Of interest is whether these distributions appear to be similar for the two classes.
Table 1
Undergraduate Student Distribution by Class
| Black | Hispanic | White | |
| Class 1 | 14 | 4 | 20 |
| Class 2 | 11 | 8 | 17 |
(a) Data Entry in SPSS
Since these data display cell frequencies---cells are the combinations of categories for each variable such as Black students in Class 1 or Hispanic students in Class 2---the cell frequencies may be entered directly in SPSS. Figure 1 below provides an illustration for SPSS data entry.
Figure 1
SPSS Data Entry of Undergraduate Student Distribution by Class
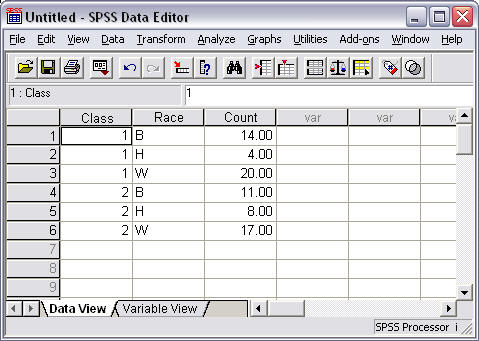
Note the first variable "Class" identifies which class is involved (either 1 or 2), the second variable "Race" identifies student race (either B, H, or W), and the final variable "Count" indicates the cell frequencies for each combination of categories for Class and Race.
(b) Weight Cases for Grouped Data
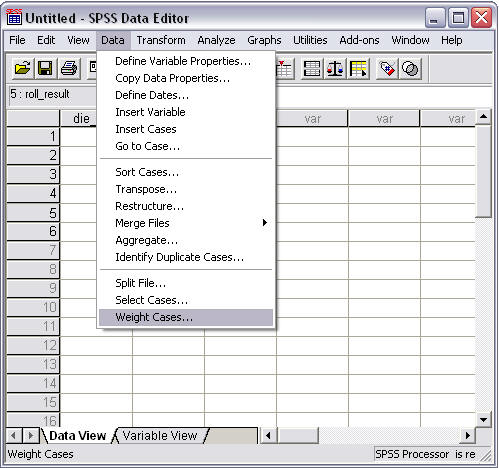
When grouped data are entered in SPSS, that is, when frequencies or counts for each possible category or cell are recorded, one must inform SPSS that counts are used instead of raw, ungroup data. The "Weight Cases" command must be used:
- Select "Data"
- Select "Weight Cases"
Figure 2 shows how the screen should appear upon selecting Data ►Weight Cases.
Figure 2
Weight Cases Command
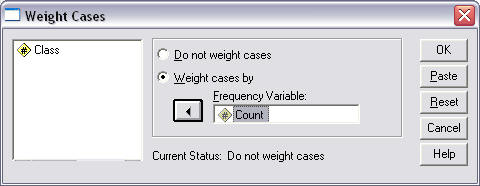
In the pop-up window that appears, select the weighting variable---the frequency of event or count of event variable---and move it to the "Frequency Variable" box as shown below in Figure 3. In this example the weighting variable is "Count." Select "OK" to complete the variable weighting process.
Figure 3
Weight Cases Pop-up Window
(c) Chi-square Commands
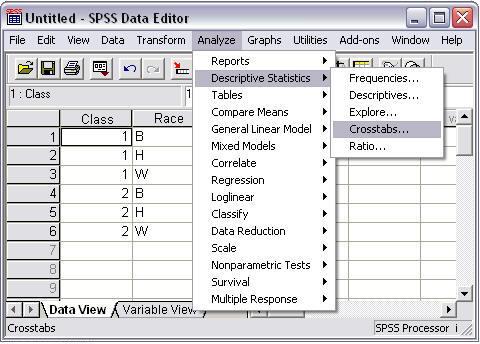
To perform the chi-square test of independence, run the following commands:
- Select "Analyze"
- Select "Descriptive Statistics"
- Select "Crosstabs"
These command selections are illustrated in Figure 4 below.
Figure 4
Chi-square Test of Independence Selection
Once the Crosstabs command is selected, the following pop-up window will appear (Figure 5):
Figure 5
Chi-square Crosstabs Command
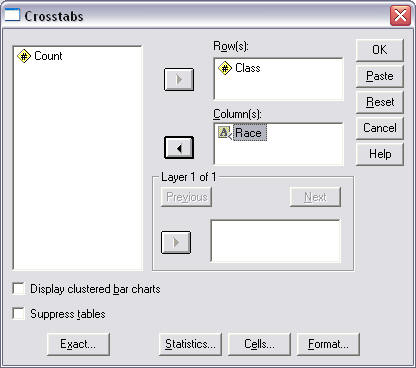
In the Crosstabs pop-up window, do the following:
- Select one variable to move to the Row(s) box ("Class" was selected to form rows), then
- move the second variable to the Column(s) box ("Race" was selected to form columns), next
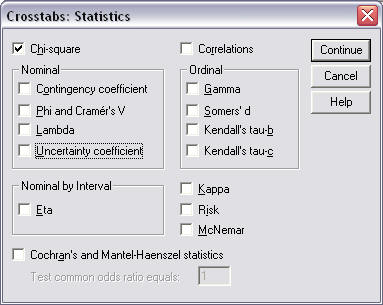
- click on "Statistics" and place a mark next to "Chi-square" (see Figure 6 below), click "Continue," then
- click "OK" to run the analysis
Figure 6
Chi-square Crosstabs Statistics Window
(d) Results
SPSS results for the chi-square test of association are provided below in Figure 7.
Figure 7
Chi-square Results
The results presented above show three tables. Each is discussed in turn.
1. Case Processing Summary
This first table simply indicates the number of observations used to form the data. A total of 74 cases present with 0 missing.
2. Class * Race Crosstabulation
The second table presents the cell counts for each variable category combination. In addition to cell counts, marginal totals are presented. For example, the marginal total for class 1 is 38 students, and for class 2 there are 36 students.
3. Chi-square Tests
The final table displays inferential statistical results. The chi-square value is reported to be 1.884 with df = 2 and p-value = .390. The column labeled "Asymp. Sig. (2-sided)" contains the p-value.
Since the reported p-value of .390 is larger than any alpha value commonly employed, one would fail to reject the null and conclude that the two classes appear to have similar racial distributions of students.
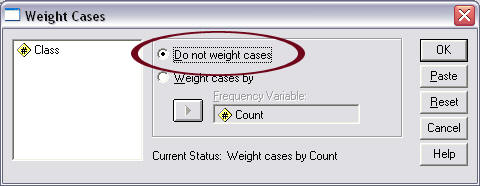
(e) Remove Weighting
It is important that one removes the weighting effect before proceeding to other analyses otherwise all results calculated will be incorrect. To remove weighting, follow these commands:
- Select "Data"
- Select "Weight Cases"
- Place mark next to "Do not weight cases"
See Figure 8 for details.
Figure 8
Removing Weighting
3. Ungrouped, Raw Data Example
The same analysis may be performed in cases where raw, ungrouped data are available. In this situation one does not weight cases by cell frequencies because SPSS will perform that calculation automatically. All SPSS commands identified above will be the same with the exception of the "Weight Cases" command which should not be used.
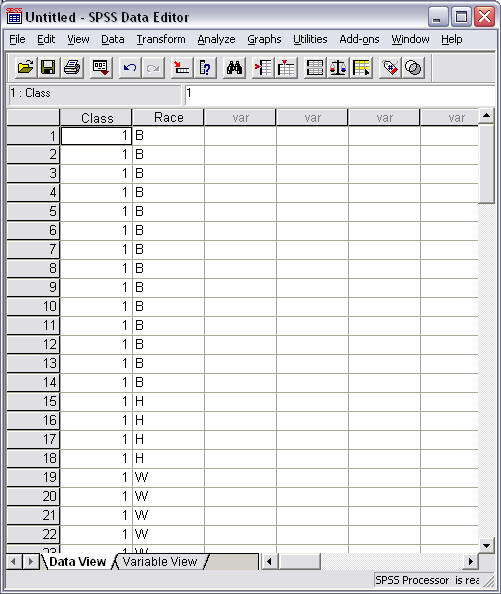
Data entry is an individual case-by-case basis. This is illustrated in Figure 9. Note that the first 14 rows indentify 14 Black students in Class 1, rows 15 to 18 identify 4 Hispanic students in Class 1, etc. These data extend through row 74 to account for all 74 students in both classes. If one must enter such data by hand, the grouped approach is more efficient if cell frequencies are known, but if data are already entered in a spreadsheet, this approach will be more efficient.
Figure 9
Ungrouped Data for Class and Race
(a) Chi-square Commands
To perform the chi-square test of independence, run the following commands:
- Select "Analyze"
- Select "Descriptive Statistics"
- Select "Crosstabs"
These command selections are illustrated above in Figure 4.
Once the Crosstabs command is selected, the pop-up window displayed in Figure 5 above will appear.
In the Crosstabs pop-up window, do the following:
- Select one variable to move to the Row(s) box ("Class" was selected to form rows), then
- move the second variable to the Column(s) box ("Race" was selected to form columns), next
- click on "Statistics" and place a mark next to "Chi-square" (see Figure 6 above), click "Continue," then
- click "OK" to run the analysis
(b) Results
SPSS results reported above are identical to those obtained for the data displayed in Figure 9.
Copyright 2011, College of Education, Georgia Southern University
Created by Bryan W. Griffin
Thursday, August 18, 2011
18 August, 2011 11:54 AM